Viewing Run Insights
The Run Insights dashboard gives you a health overview of your monitored workflows, so you can spot workflows that have drifted from their baseline, hit errors, or received no response — before anyone reports a problem.
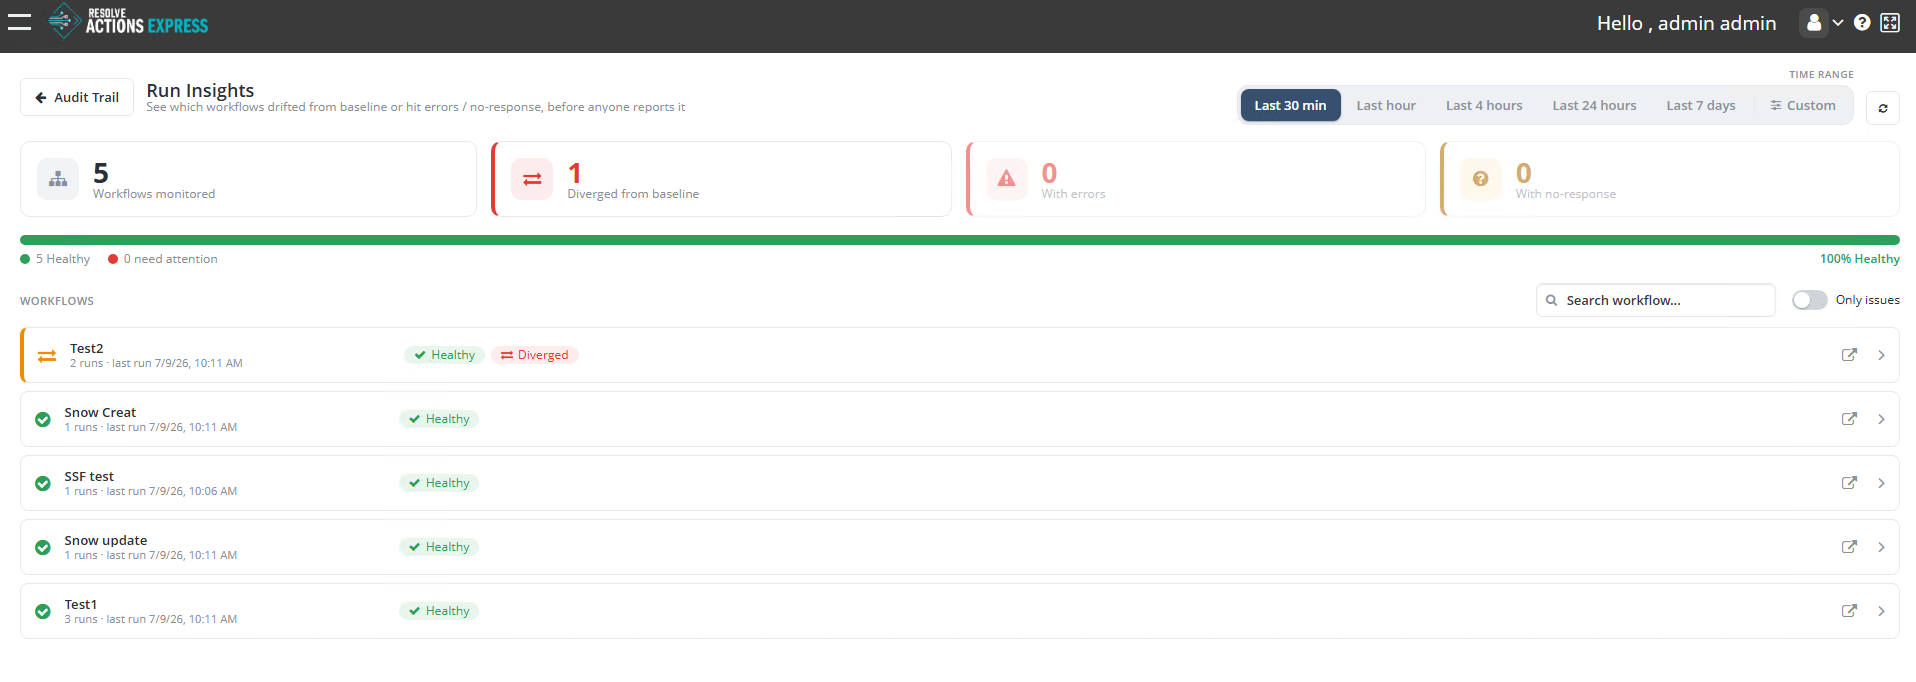
Displaying the Run Insights Dashboard
From the top menu, go to Insight > Run Insights.
The Run Insights dashboard displays:
- Summary counters—Workflows monitored, Diverged from baseline, With errors, With no response.
- Health bar—The percentage of monitored workflows that are Healthy versus Need attention.
- Workflow list—Each monitored workflow, with its run count, last run time, and status.
Setting the Time Range
Use the Time Range options at the top right to control which runs are included in the summary:
- Last 30 min (default)
- Last hour
- Last 4 hours
- Last 24 hours
- Last 7 days
- Custom—Specify any number of minutes, hours, or days
Searching and Filtering Workflows
- Use the Search workflow field to find a workflow by name.
- Toggle Only issues to show only workflows that are diverged, have errors, or have no response.
Workflow List
Each row in the workflow list shows:
| Column | Description |
|---|---|
| Workflow name | Name of the monitored workflow, with an icon indicating its overall status |
| Runs / Last run | Number of runs in the selected time range and the timestamp of the most recent run |
| Status badge | Healthy, Diverged, Errors, or No response |
Click a workflow row (or the expand arrow) to open the Run Comparison screen for that workflow. The icon at the far right of each row opens the comparison in a new tab.