System Health
The System Health view provides information about the health status of the services included in your Resolve Insights installation.
The displayed information relates to the machines and services making up Insights. It is independent of the devices, services, and applications in the Insights inventory.
Accessing the System Health View
The System Health page can be accessed in two ways:
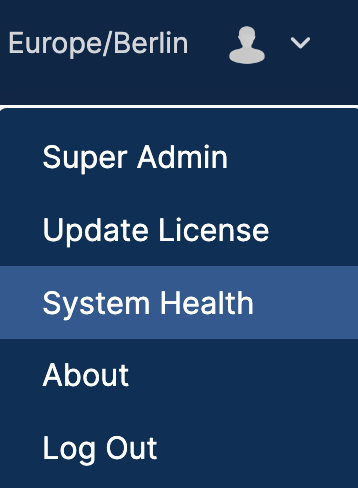
- By clicking System Health in the Insights login screen.note
Opening the page from the login screen doesn't require you to be logged in.
- By selecting System Health from the use profile menu in the Insights main menu at the top.
System Health Overview
After you open the System Health view, you will see a couple of lists. Each list represents an Insights server in your setup with all services used by the Insights application included in it.
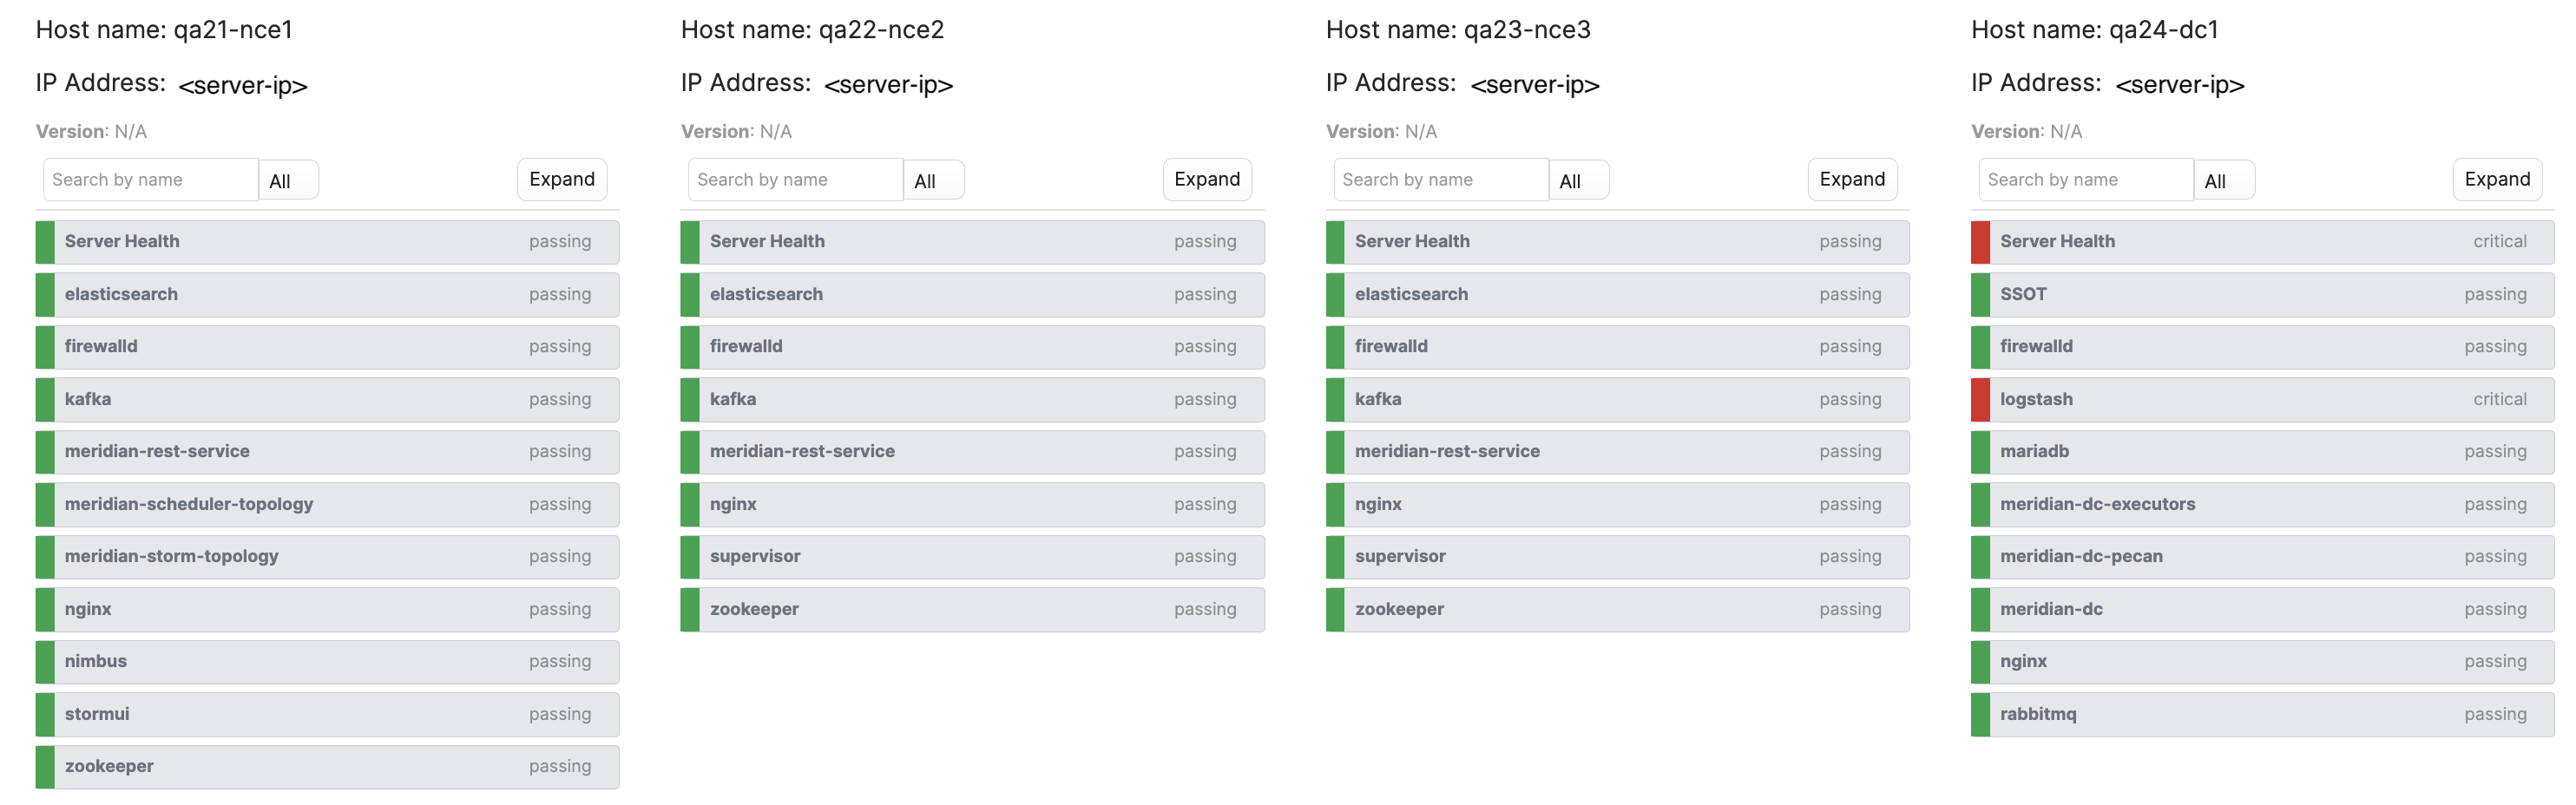
It consists of the following components:
- Host Name—The Insights node's hostname that you set during installation.
Depending on how you have configured the DC and the NCE clusters, you will see either a single or multiple nodes of each type. You can cross-check the node type by looking up the hostname in your installation configuration files. - IP Address—The IP address of the Insights server.
- Version—The version of your Insights installation.
- Filters—You can search for a specific service by typing its name in the search box. Next to it is a drop-down list with all possible statuses by which you can filter services: passing, warning, critical, or disabled.
- Expand—Clicking the button will display the health status details for each of the services. Clicking it again will collapse the list.
To expand the details only for a specific service, click on it in the list.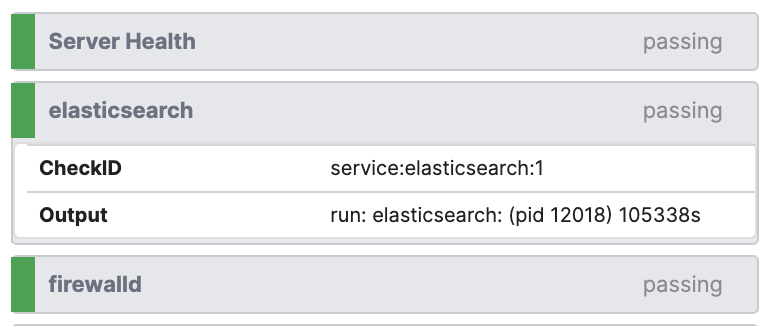
- List of the services installed with the Insights setup and their current status.
Configuring System Health Criteria
The criteria that determine the status and the order in which the various services are displayed in the list are configured in a JSON file located under /opt/meridian/conf/health. Depending on the type of the node (NCE or DC), the file is named health_config_nce.json or health_config_dc.json.
Commonly, if even one of the services in the group has a status different from "passing", the Server Health of the entire group will be displayed with the same status to indicate a potential issue. However, you can always modify this configuration and add your own criteria that will define the system health appearance.