Analytics Dashboard
Analytics Dashboard
The Analytics Dashboard provides an overview of workflow activity, displaying Workflow Statistics and the Workflow Statistics Table on the main screen.
Navigation
The top menu bar includes options to:
- Toggle between the Analytics Dashboard and Workflow Costs.
- Export the displayed data.
For details on the Workflow Costs Dashboard, see Viewing Analytics Charts.
Workflow Statistics
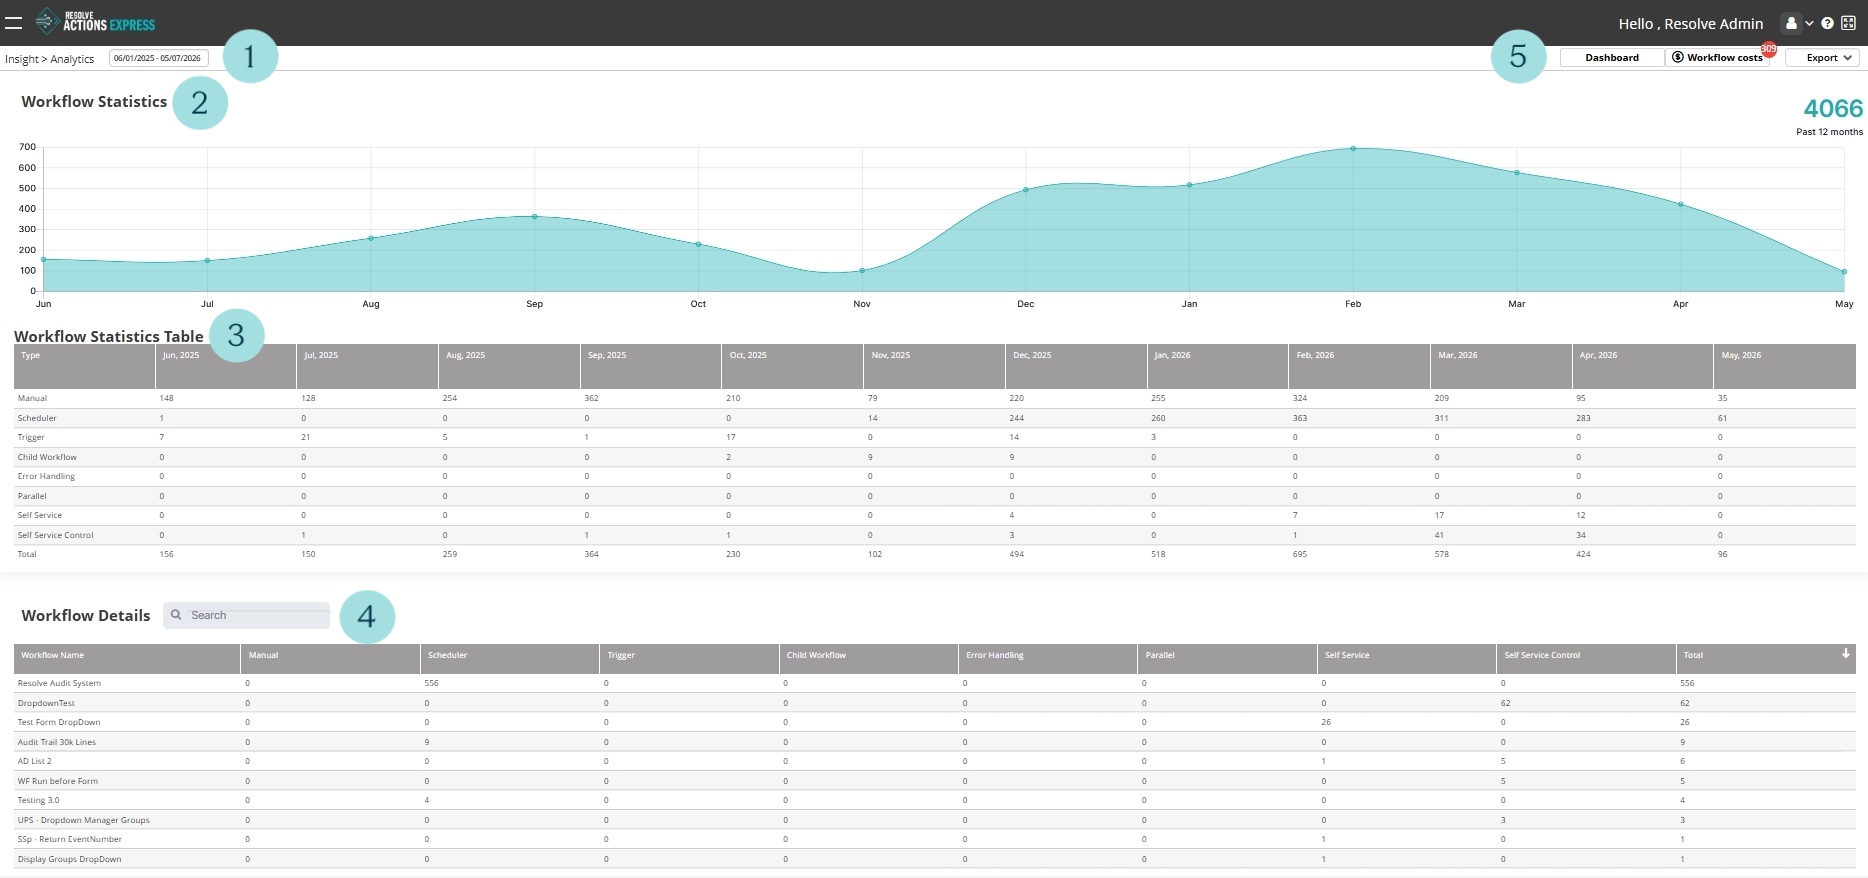
A graphical representation of your executed workflow volume over a specified period is displayed.
- You can adjust the date range using the selector in the top left corner.
- The Workflow Statistics section is a graphical representation of the number of workflows run.
- The Workflow Statistics Table breaks down the data by type of workflow, including:
- Manual
- Scheduler
- Trigger
- Child Workflow
- Error Handling
- Parallel
- Self Service
- Self Service Control
- The Workflow Details section includes a searchable list of all workflows by name with individual running details.
- The top right menu, includes:
- Dashboard to switch to the dashboard view.
- Workflow costs to switch to cost analytics.
- Export to export workflow data.