Data Explorer
This page is available only on the old Insights User Interface.
If you are working on the new User Interface, you will not be able to see this page. Please use the Legacy Insights button in the top-right corner of the header to return to the old interface and access this page.
Overview
Resolve Insights discovers all your application services and infrastructure resources in your network and provides a highly automated way for you to group them into a hierarchy of groups based on business or operational priorities.
You can explore data for analysis by hierarchy, composition, and many-to-many relationships. It is available in the Data Explorer. You can also ingest additional data from your CMDB using a simple upload function.
Managing the Data
You can explore your data by querying your data or applying different filters.
Filtering Components
You can use the attributes provided by default in Insights to define what kind of data you want to see in the explorer view. To create a filter, use the following steps:
- In the left navigation bat, click Data Explorer. A list of attributes appears.
- Select the attributes that you want to filter by:
- Scroll the list or use the search box to find the attributes that you want.
- Drag-and-drop or double-click the attribute to move it to the condition area on top.
- Optionally, specify which components to add by clicking the funnel icon to the right of the attribute name.
A list of components is displayed.- Use the search box to find components.
- Check or uncheck the box in the component's row to select or unselect the data as a search criterion.
- Optionally, change the order of attributes by dragging them up or down.
- Remove an attribute from the filtering section by clicking the Remove (X) icon to the right of the name.
- Click Submit to apply the filter and see the data.
In the list of available attributes, you can hide attributes that you don't use often.
To hide an attribute, click the eye icon next to an attribute.
To unhide an attribute, take these steps:
- Click the Show Hidden/Show Unhidden eye icon next to the search box. This action lists all hidden attributes.
- Click the eye icon next to a hidden attribute to unhide it.
- Click the Show Hidden/Show Unhidden eye icon next to the search box again to return to the "shown" list.
Working with Saved Queries
Creating a Saved Query
The saved queries allow you to easily access your favorite metrics. Rather than entering the same query parameters over and over again, queries can be easily saved and edited.
- Create the filter as explained in Filtering Components.
- Click the Save icon.
- In Description, enter the description for the query.
- Click Save.
A confirmation dialog box is displayed and the query is saved to the Saved Queries pane.
Viewing Saved Queries
You can load one or more saved queries and view the results.
- Click Saved Queries.
The list of saved queries is displayed. - Enter a word or phrase that you want to search for in the search field of the saved query and then select it or select the query from the list.
Deleting a Saved Query
You can delete a saved query.
- Click Saved Queries.
The list of saved queries is displayed. - Click Remove (the X icon) to delete the required query.
- Click OK.
Printing Data
You can print the hierarchical data. To print data:
- Click the Export icon.
The print preview will be displayed.noteTo print the hierarchical data, your system must be connected to a printer.
- Select the required printing options and click Print.
Setting the Display Size
You can set the size and the details that will appear for a particular query after changing the display size.
- Create a query or open a saved query.
- Click the Set Size (gear) icon next to the search field.
- Enter the values for width and height in the Width and Height fields.
- Click Submit.
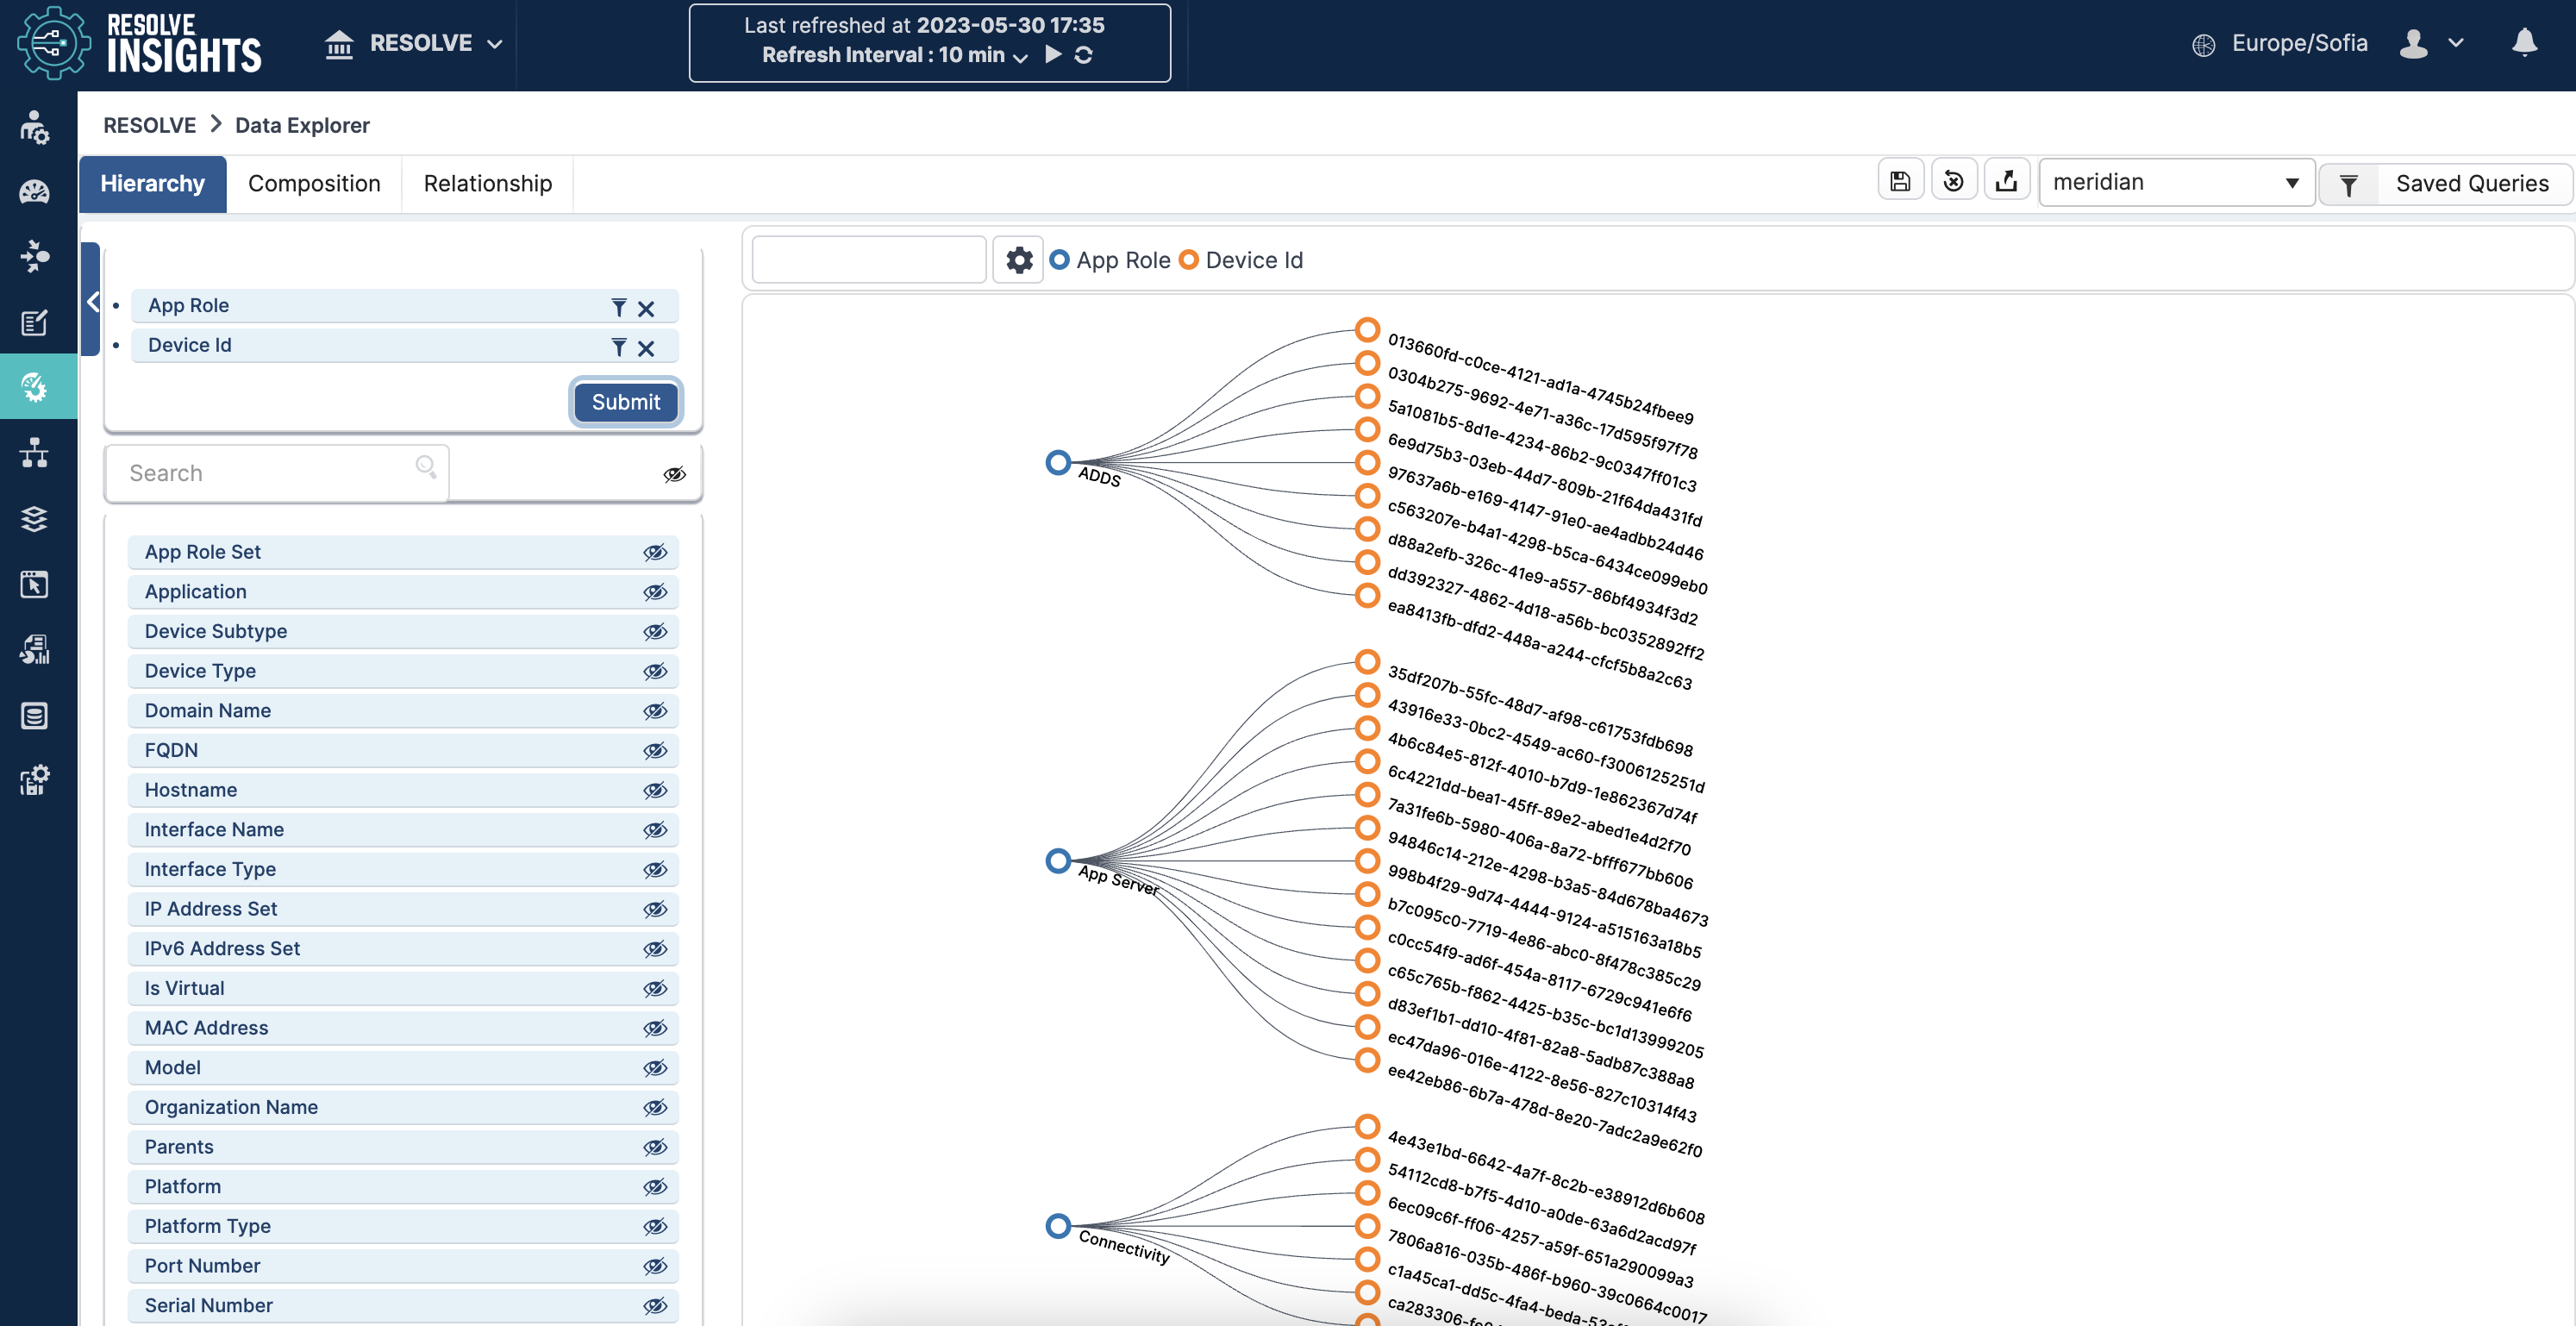
Viewing Hierarchical Data
The Data Explorer > Hierarchy view shows the content of the specified attributes as an interactive tree structure. The map shows the connections between the different levels and allows you to zoom in from the global view down to the lowest level. It provides a comprehensive view of dependencies across all the data center devices.
In that view, you can search for a component and see where it's located in the hierarchy map and how it connects to the different levels.
Viewing Composition Data
The Data Explorer > Composition view shows the content of specified attributes in a pie chart. This is a visualization feature by size and count measurements.
You can choose different attributes to show on the pie chart, such as Platform, Platform Type, and Model. Labels describe each slice of the pie chart which is displayed next to each slice.
You can apply search to easily find the component you are interested in.
- Platforms are grouped in the inner circle, Platform Types are grouped in the middle circle, and Applications are grouped in the outer circle.
- Click on a slice to view the subtypes of the selected attribute, in a new pie chart.
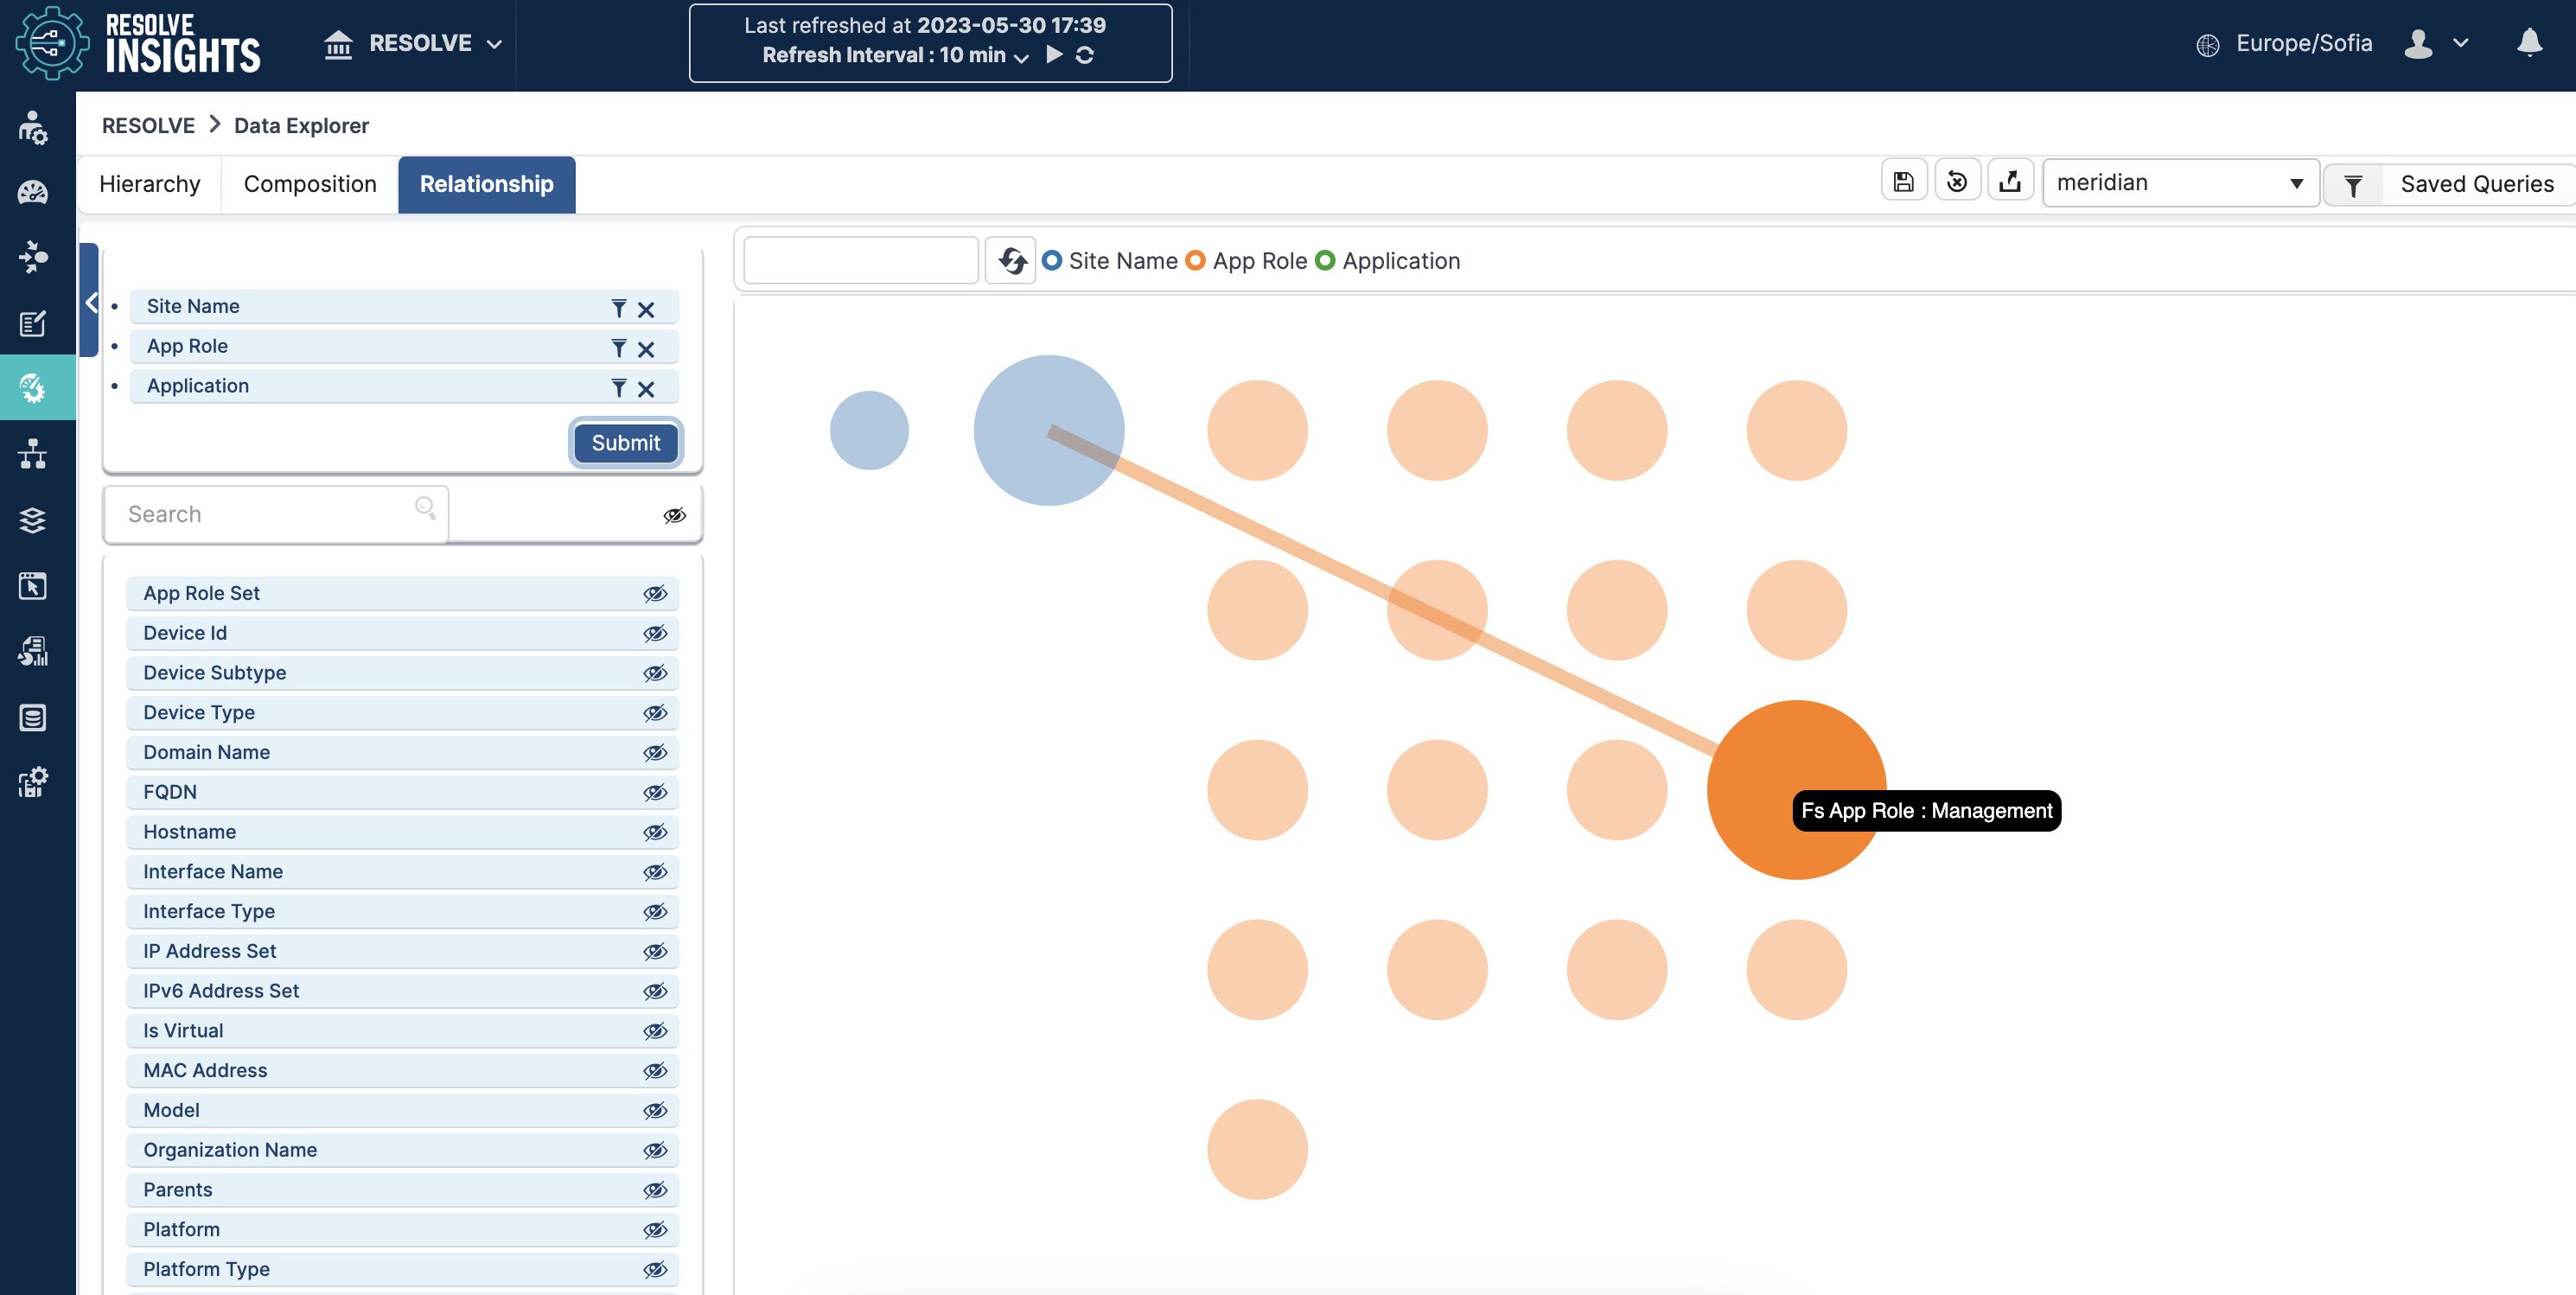
Viewing Relational Data
The Data Explorer > Relationship view shows the same content as interactive areas that you can hover to view their connections. The map illustrates the relationship between the components in your environment. Upon clicking a component, a details view with the selected relations is displayed.
In that view, you can search for a component and see what relationships it has with the other components.